The survey highlights demand for investment in hard currency Asia debt (weighted arithmetic mean = 3.60), with demand for local currency Asian debt (3.43) ranking second in this list (fig 19).
Looking at individual markets, respondents highlighted China (weighted mean = 3.35), South Korea (3.41) and India (3.06) as offering the strongest opportunities to fixed income investors.
At the foot of the rankings, the survey identifies South Africa (weighted arithmetic mean = 2.39), the Middle East and North Africa (2.70) and Latin America (2.64) as offering the weakest outlook from this list of emerging market debt options, mirroring respondents’ predictions for emerging market equities.
Impact of the Covid-19 outbreak
Exploring how financial markets will react to the Covid-19 outbreak over the coming 18 months, 33% of respondents believe that, after a strong rally in developed equities since March, the markets are likely to fall further when the full extent of economic damage becomes apparent (fig 20).
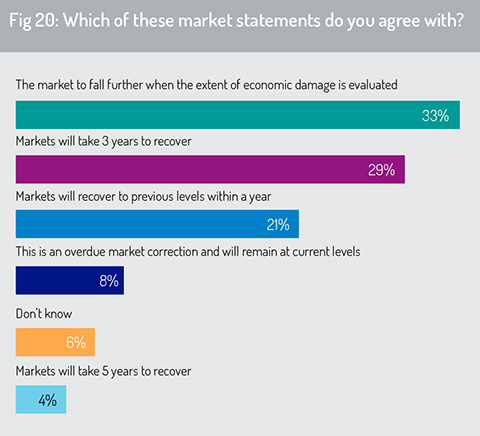 Looking at the pace of recovery, 29% of respondents believe that it will take at least three years for markets to recover to pre-crisis levels. However, 21% are more optimistic, stating that markets will recover to previous levels within 12 months.
Reflecting on the longer-term financial outlook, Punter Southall Wealth CIO Thomas Becket says: “As a result of the large-scale monetary and fiscal stimulation, in my opinion, inflation risk is understated. Real assets are likely to be on the agenda as a hedge to inflation.
“Another area to watch is the nationalisation of supply chains, which could lead to bottlenecks across the world and hinder the recovery of the economy.
“We are in an unprecedented situation and investors need to be alert to future risks, but also recognise that within the challenging backdrop, there remain good opportunities for our clients.”
Currency risk
To identify where respondents identify high levels of currency risk, the survey invited participants to evaluate currency risk from ‘very strong’ (6) to ‘very weak’ (1) across seven currency pairs (fig 21). A comparative measure of currency risk was then calculated for each currency pair using a weighted-arithmetic mean.
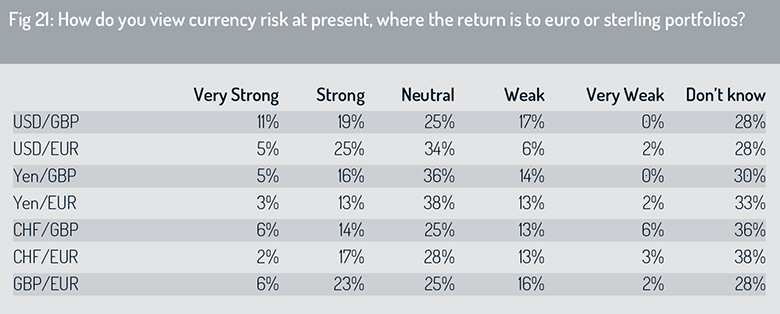
From this list, respondents perceive highest currency risk in the US dollar to euro (USD/EUR, weighted-arithmetic mean = 0.161) and US dollar to GBP (USD/GBP, 0.160) currency pairs.
The Swiss franc was believed to offer a measure of stability against sterling and the euro, with the CHF/GBP and CHF/EUR currency pairs offering the lowest level of currency risk in this list (weighted-arithmetic mean for CHF/GBP = 0.129, for CHF/EUR=0.127).
Sterling to euro sits in the middle of this currency risk spectrum (GBP/EUR weighted-arithmetic mean = 0.154) – with potential currency volatility associated with uncertainties around Brexit being overlain on top of the global economic concerns linked to Covid-19.
In two weeks during March, the US dollar strengthened by 5.3% against the euro, 5.9% versus the Swiss franc, 7.7% against the Japanese yen and by 13.9% against sterling, benefiting from its status as global reserve currency and safe haven during the early stages of the crisis.
However, subsequently the USD has weakened dramatically. By the end of July, the USD index hit its lowest level since September 2018 amid concerns about the pace of economic recovery in the US and the surge in positive Covid-19 cases diagnosed in recent weeks.
After losing ground against the US dollar in early March, sterling has strengthened subsequently with the GBP/USD spot rate rising from a low point of 1.14 on March 23 to 1.31 on July 31.
 The Swiss franc has gained ground against the USD since the pandemic began, with CHF/USD spot rates rising from 1.01 on March 21 to 1.10 on July 30.
The same is true for euro-dollar spot rates, where EUR/USD has climbed from a low of 1.07 on March 20 to 1.17 on July 30.
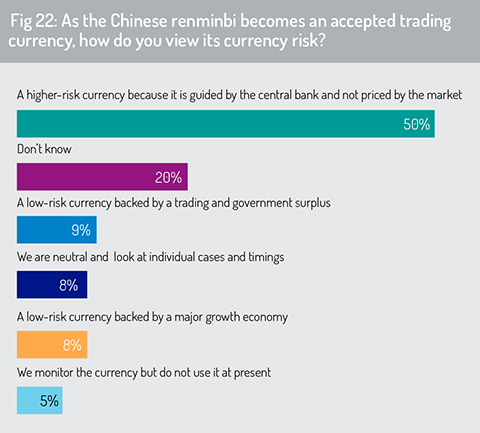
Looking specifically at the Chinese renminbi, almost 50% of survey respondents say that RMB presents currency risk owing to the absence of full currency convertibility and because the currency is guided by the People’s Bank of China (PBOC), the central bank, rather than priced through the market (fig 22). The PBOC provides a ‘daily fix’ for the onshore CNY, with the currency trading in a band around this reference rate.
Fewer than 10% of respondents say that RMB presents a low currency risk because it is backed by a trade surplus. China’s trade surplus has narrowed significantly over the past decade. On joining the World Trade Organization in 2001, Chinese exports of goods and services climbed from 20% of GDP in 2001 to 36% in 2007 – and the current accounts surplus rose to 10% of GDP in 2007. But by 2011, the trade surplus had declined to 1.8% of GDP.
The IMF proposes in a November 2019 working paper, ‘The Drivers, Implications and Outlook for China’s Shrinking Current Account Surplus’ (by Pragyan Deb, Albe Gjonbalaj and Swarnali Hannan) that this current account surplus, having narrowed dramatically from its peak in 2008, may turn to a modest current account deficit in the decade ahead.
© 2020 funds europe