Laurent Denayer of EY in Luxembourg condenses a year of patterns in fund distribution into one neat set of idioms.
2014 was an excellent year for the most active players in fund management. The analysis carried out between April 2014 and March 2015 confirms that growth in open-ended funds (with the exception of hedge funds and exchange-traded funds) predominantly came from the key markets of the old continent.
The following idioms depict global open-ended fund distribution over the 12-month period ending March 2015.
A HARD NUT TO CRACK
Investors’ appetite for cross-border funds is further confirmed.
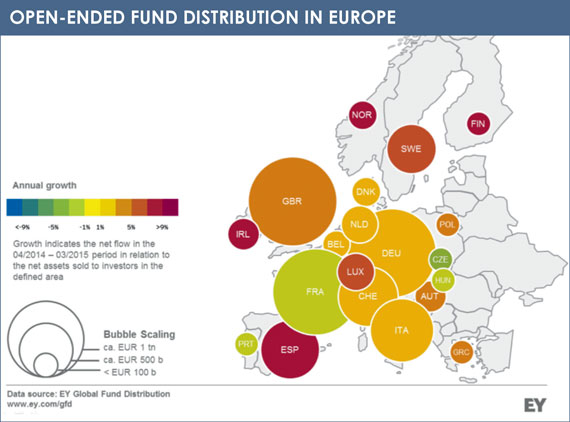
Once more, cross-border funds have had the most prominent place on the menu: 70% of net fund flows in Europe were captured by cross-border funds. Luxembourg alone has captured 58% of these European fund flows, fuelling the curiosity and jealousy of other financial centres, who are wishing to wine and dine à la Luxembourgoise. Luxembourg, the global leader in cross-border fund distribution keeps growing every year (Ireland to a lesser extent), despite already having a lot on its plate.
BIG SOMETIMES REALLY IS BEAUTIFUL
Despite the difficult economic environment, the big traditional European fund distribution markets have generally performed well: Germany grew by 3.6%, the UK by 3.4%, Switzerland by 3%, Italy by 4.4% and Spain by 6.8%. France is the exception with a decline of 0.2%. It was overtaken in size by the UK and fell to third place on the European podium. Germany remains the undisputed leader in assets distributed. The Nordic countries enjoyed very strong growth rates (Finland +8%, Norway +5.9%, Sweden +5.7%, Denmark +2.6%).
Small ‘peripheral’ markets continued to eat like birds: Czech Republic declined by -1%, Portugal by -3.4% and Malta by -47%. (Malta’s figures are due to the closure of the biggest fund in Malta, which represented almost 50% of Maltese assets.)
The similarity in the figures is deceptive. Given the size of the various markets, the differences are highly significant: for example the flows generated in the UK over the past 12 months are equivalent to the size of the markets of Hungary, the Czech Republic, Malta and Portugal combined. It is as if the English market has absorbed the assets of all of these countries in the past 12 months.
The US continues to dominate with local funds, capturing more than 50% of the global market for open-ended investment funds and growing by 1.5%.
In general, Asia has been in decline. Korea recorded a negative performance of -6.5% and the Gulf countries have suffered from the drop in the oil price (-14.5% Bahrain, United Arab Emirates -14.4%). However, Hong Kong (+5.6%), Saudi Arabia (6.2%) and India (+25.1%) performed well.
Peru, Colombia, Mexico are the trifecta in Latin America. Brazil declined by 9.3%. On the other side of the southern hemisphere, Australia and South Africa have had a stable performance.
Fund managers are now eagerly contemplating markets such as Mexico, Colombia, Israel, Saudi Arabia, Thailand and Malaysia. New fund distribution Eldorados may be confirmed in 2015.
ALL EGGS IN ONE BASKET MAKE A GOOD OMELET
Investors have generally favoured traditional and global strategies and have recently acquired a taste for allocation strategies as well. Investments in emerging markets strategies have suffered.
The economic and geopolitical uncertainty means that investors increasingly seek to diversify their risks by using multi-asset strategies. Allocation strategies (which mix several asset classes, such as equity, fixed income and cash) have attracted more than 60% of the flow of European investors and currently account for over 13% of European investors portfolios, against 10.8% a year earlier. The same can be seen on a global scale: over 50% of new money has flown to this investment strategy. Managers who did not offer this strategy were not able to gain their slice of the cake.
DIVIDE AND RULE
The industry still remains relatively fragmented. The 20 largest managers account for about 45% of the assets managed by investment funds.
This proportion varies considerably by region. In Europe, the top 20 represents only 40% of the market, as in Asia. It is 70% in North America. This rises to around 80% in Oceania, Africa and Latin America, although it must be emphasized that in these regions, the ranking is dominated by US and European managers.
KNOWLEDGE IS POWER
The market share of the top leading managers grew more than the rest of the market. Any increase in market share can only come from three factors: better relative fund performance, better positioning in terms of products and/or a better marketing strategy. The top 20 usually manage multi-classes and multi-strategies. The strategies that have worked well last year have generally favoured global rather than niche players. Increasing one’s market share also requires a good understanding of the distribution channels and regulatory requirements.
 The majority of positive fund flows are usually experienced by ‘new’ funds, those no older than five years, proving that innovation is the key to adapt products to demand.
Marketing aspects are also increasingly important when financial markets are stable or in decline. Investment managers are increasingly trying to get closer to investors. This requires more and more direct approaches, for example by using social media or the purchase of market intelligence data that spills the beans on investor demands and market trends. Never before have fund managers spent so much on advertising and fund branding in the hope of increasing their visibility.
In conclusion, it is important to understand and anticipate investors’ appetite in each market. Despite similar figures, each market has its specific features, driven by investors’ cultural investment criteria and the regulatory and tax environment.
After all, variety is the spice of life. Fund managers increasingly need to develop market intelligence that captures investors’ signals in order to develop products that provide growth and bring home the bacon.
Laurent Denayer is a partner at EY and leader of EY Global Fund Distribution. Figures given for the size of markets take account of domestic funds and market share generated by cross-border funds.
©2015 funds europe