Alan Chalmers looks at the latest asset manager rankings from Willis Towers Watson, which show an industry in a state of growth and some jostling for position among the larger players.
Assets under management (AuM) for the global industry showed a strong surge in 2017. Recent data compiled by Willis Towers Watson and published by the Thinking Ahead Institute shows that the top 50 players’ AuM has grown approximately 17.25% in terms of the assets they invested.
In pure cash terms, that growth was from $52,968 billion at the end of 2016 to $62,107 billion a year later.
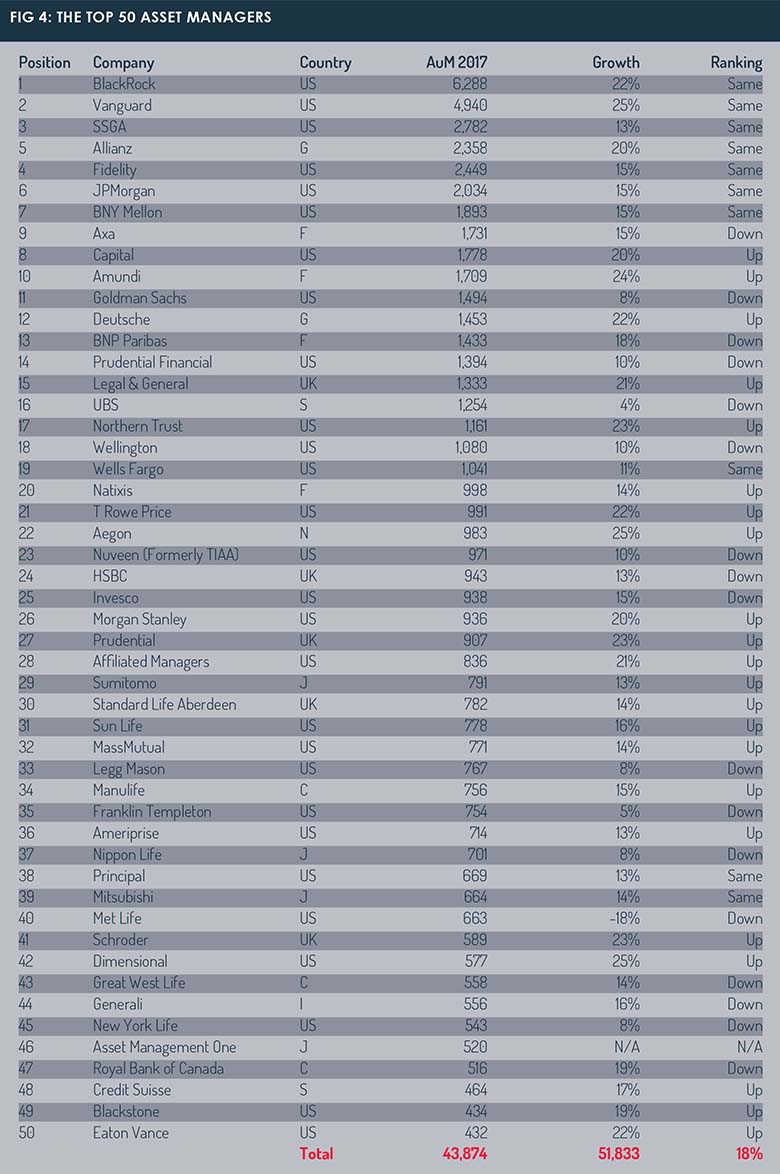
The top three firms by size remained BlackRock, Vanguard and State Street – growing by 22%, 25% and 13%, respectively. Growth came from three primary factors: markets, consolidation and positive investor inflows.
In attempting to look behind these figures, we have tried to estimate the market growth using a weighted average.
 Superficially, we saw a 17.25% increase in AuM at the top 50 asset managers. Almost 21% of this could have come from market performance and a small percentage (1.1%) from mergers. Balancing this was the -4.74% shrinkage due to outflows.
In fairness, this is a spurious figure as it is based on an average-weighted calculation and 2017 was not an average year. This also does not cover the lower return bias for bonds-versus-equities, or geographical spread or home-market bias for equities, nor indeed the effect of currencies.
Markets and currencies
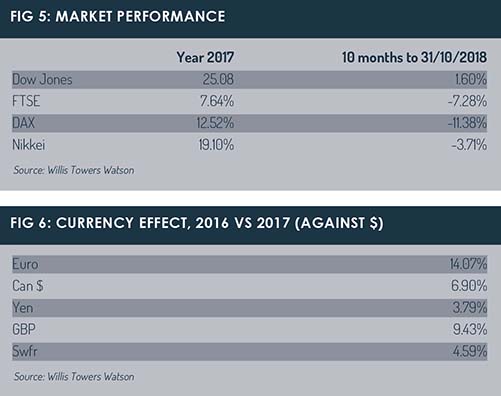
Looking at market performance for 2017 in the US, UK, Germany and Japan, returns were between 25% for the Dow Jones and just under 8% for the FTSE. In the ten-month period to October 31, 2018, the Dax sank as low as -11.38%, though the Dow still managed 1.60% (see Fig 5).
The Dax at 12.52% for 2017 is highlighted to give an indication of the performance of European companies, but note that the Paris CAC 40 figure for the same period was 9.26%. We have used the Dow Jones to reflect Canada’s performance.
Weighting returns for the split of assets invested in these markets produces a weighted return for 2017 of 20.89% and of -1.1% for the ten months to October 31, 2018.
These returns are ominous for the eventual 2018 AuM figure and highlight how the market makes it difficult to get a clear picture. Most of the asset managers will have a home-market bias and as a result, any given increase for a US player – by 25%, say – compared to the Dow Jones increase in 2017 of 25.08%, may not be as good as, say, an 11% increase for a UK player compared to a 7.64% market performance without looking at currency.
Whilst having a bearing on these figures, much will depend upon the geographical exposure of the asset managers, as well as the asset class exposure in relation to equities and bonds.
As all the tables are denominated in US dollars and converted at ruling rates at the year-end, consideration has to be given to currency movements. Again, this is not exact as assets are often denominated in various currencies within portfolios, which mitigate the year-end currency conversion effect. Currency movements between 2016 and 2017 (see Fig 6) were large for the euro (14%) and much smaller for the yen (3.79%).
Market performance and currencies need to be taken into account when looking at AuM growth and trying to determine success or failure when looking at the Top 50 Chart.
Consolidation
The larger consolidation plays among the top 50 players included Amundi (2016 AuM: $1,141 billion) acquiring Pioneer Investments (2016 AuM: $241 billion). There was also the Aberdeen Asset Management (2016 AuM: $347 billion) merger with Standard Life (2016 AuM: $343 billion).
In addition to these headline actions, there were smaller acquisitions across the Top 50 as asset managers try to expand their capability in two key areas: alternative investments and advice.
And the merger trend has continued into 2018. Federated (2017 AuM: $398 billion) announced it was acquiring Hermès, and Invesco (2017 AuM: $938 billion) announced it was acquiring Oppenheimer. M&A activity is likely to continue for a number of mid-sized managers as they try to acquire more scale and larger fund ranges.
There have also been deals such as HNA Capital acquiring a stake in Old Mutual, Softbank acquiring Fortress, and Fortress and Nippon Life acquiring TCW.
A number of bank-owned asset managers changed their structures. Deutsche Bank, for example, floated off its asset management arm as DWS Group and similarly, South Africa-based bank Invetec is looking to take Investec Asset Management public in 2019.
More change is expected through a variety of corporate actions as asset managers battle increased margin pressure, greater competition from passive players and higher regulatory costs.
PwC has reported there was just over $40 billion of M&A deals in the funds industry during 2017. This was likely to continue in 2018 and into 2019. In fact, according to the EY M&A Global Capital Confidence Barometer, in the second half of 2018, 38% of respondents were expected to pursue M&A activity in the next year.
Asset allocation
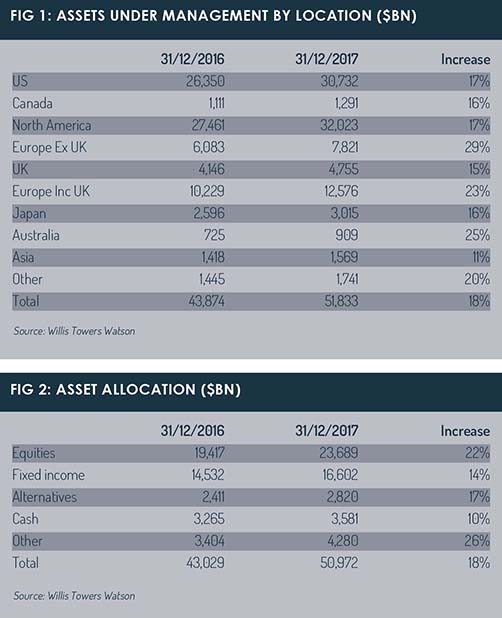
Not all entrants to the survey gave asset allocation splits either between investment categories or geographical location, but based on the respondents’ replies, equities grew by 22%, fixed income by 14%, alternatives by 17%, other assets – predominately multi-asset – by 26% and cash 10%.
Based on feedback for 2018, the industry is likely to see even more growth for multi-asset. This asset class seems to be becoming the asset class of choice in Europe and to a degree in Asia, both in an investor’s pre- and post-retirement life.
Similarly, the alternatives area is seeing huge growth institutionally, as well as becoming a component of multi-asset strategies for its ability to deliver enhanced growth in a low bond yield environment and at a time when markets are highly valued.
Looking at the geographical split of asset growth, the biggest recipient was Europe ex-UK growing at 29%, with the UK growing at 15%. This disparity reflects poorer market returns but no doubt behind that were also concerns about Brexit.
US firms continued to see very strong growth in assets at 17%. Meanwhile, Australia’s assets grew by 20%, which no doubt reflected the strong market performance and strong inflows from mandatory pension schemes. Watch for more international diversification from Australian investors.
Interestingly, the top 20 managers increased their share of AuM by 1%, taking their share of the top 50 total assets to 43.3% this year, compared to a 42.3% share last year. This came substantially at the expense of much smaller managers.
As of November, there had been a significant downturn in emerging markets, particularly China. This was partly as a result of increased trade tensions with the US, but due to the complexity of global trade, this had wider implications on other Asian markets too, and a knock-on effect for developed markets at the end of 2018.
There were some notable acquisitions over the past year that influenced asset growth at some firms: Aegon – which already acquired Cofunds in late 2016 – acquired the DC platform of BlackRock in the UK during 2018; Aberdeen Asset Management – which in 2016 had acquired the robo-adviser Parmenion and merged with Standard Life – acquired Elevate, the Axa platform, for its own platform business in late 2016. The consolidations reflect the efforts by some asset management companies to move closer to their customers.
Passive: a continuing trend
The leading passive managers grew 19.5% over the survey period. This was from a starting base of $16,651 billion, to $19,891 billion. The large passive providers were represented by the top three asset managers overall: BlackRock, Vanguard and State Street.
This trend continues as some traditional asset managers such as Fidelity, Franklin Templeton, JP Morgan, Schroders and Aberdeen Standard launched ETF products in Europe. Amundi, Deutsche Bank, Lyxor (Societe Generale), UBS and HSBC were strong in addition to the US players.
In the case of Vanguard, it is currently making a big play for the direct-to-consumer market in Europe.
There was consolidation in the indexing business, with ETF Securities selling its businesses to WisdomTree.
Narrowing margins has created issues not just for active managers, but also for passive players.
Strong performers
The charts show some of the winners and losers of 2017. It is always difficult to get a true picture of asset growth, given the effects of market performance and currency movements.
The top ten performers changed. Amundi entered the top ten and in doing so, knocked Goldman Sachs down to 11. In the top 20, Prudential, Wellington and UBS all slipped a place, with Deutsche, Northern Trust and Legal & General moving upwards.
 The strongest growth figures came from Dimensional, Aegon and Vanguard at 25%. They were closely followed by Amundi, Schroders, BlackRock, Prudential, Northern Trust, T Rowe Price, Eaton Vance, Deutsche, Affiliated and Legal & General, which all scored over 20%. Amundi’s growth excluded the acquisition of Pioneer.
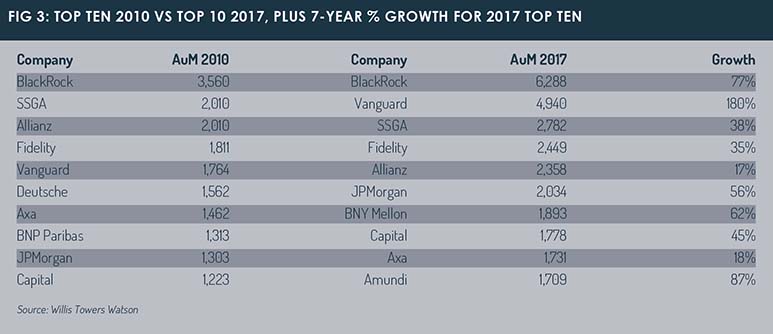
In 2010, the top five players were BlackRock, State Street Global Advisors (SSGA), Allianz Global Investors, Fidelity and Vanguard. Seven years later, the players were the same, though the order had shifted a little: BlackRock, Vanguard, SSGA, Fidelity and Allianz GI.
Their growth rates were: BlackRock, 77%; Vanguard, 180%; SSGA, 38%; Fidelity, 35%; and Allianz GI, 17%. Allianz was impacted by its Pimco subsidiary, which lost star fund manager Bill Gross.
It will be interesting to see if next year’s top-five ranking offers a more radical change. The forces shaping asset management at present are many: consolidation, passive investments, the rise of alternatives and more multi-asset investing.
Markers for the future include the growth of ESG, more investment in China and the growth of ‘solutions’ strategies; while the challenges of lower margins, regulation and the changing distribution landscape persist.
©2018 funds europe